Observability 101: Understand Kubernetes Logging

What is Kubernetes Logging?
Kubernetes logging is the systematic collection, aggregation, and analysis of logs produced by components in a Kubernetes environment. These logs are generated by various sources such as containers, pods, services, and the control plane, including the Kubernetes API server, etcd, and kubelet.
Understanding Kubernetes Log Architecture
Logs in Kubernetes are generated in two primary formats:
- Standard Output and Standard Error (stdout/stderr): Containers running in pods typically write their logs to stdout/stderr. These logs are then captured and managed by the container runtime and are accessible via the Kubernetes API.
- Log files on Nodes: System components log to files on the nodes' filesystem. These include logs from kubelet, container runtime, and network plugins.
Logs can be stored and managed using various backend solutions like Elasticsearch, Fluentd, and Kibana (EFK) stack or Prometheus and Grafana for more advanced querying and visualization capabilities.
Why is Kubernetes Logging Important?
Effective logging in Kubernetes facilitates:
- Proactive Monitoring: Real-time log analysis can alert administrators to anomalies or performance issues.
- Root Cause Analysis: Detailed logs enable in-depth investigation of failures or irregularities.
- Capacity Planning: Logs provide data on resource usage patterns, aiding in efficient scaling decisions.
Different Levels of Kubernetes Logging
1. Pod Level Logging: At the pod level, logs are primarily concerned with the output of the individual containers. Kubernetes doesn't provide native storage for these logs, so external tools are often used for log aggregation and retention.
Technical Details:
- Accessing Logs: Use kubectl logs <pod-name> to access logs.
- Log Rotation: Containers' log output can be rotated and managed by the container runtime.
- Sidecar Containers: Sometimes used to handle log shipping to a central repository.
Sample Pod Log:

2. Node Level Logging: Node-level logging captures logs related to Kubernetes components running on each node, such as kubelet or the container runtime.
Technical Details:
- Location: Found in /var/log/ directory on each node.
- Managed by: Systemd or other logging daemons on the host machine.
- Kubelet Logs: Include vital information about pod scheduling and node status.
Sample Node Log:

3. Cluster Level Logging: Cluster-level logging aggregates logs from all over the Kubernetes cluster. This is crucial for a holistic view of the cluster's health and performance.
Technical Details:
- Tools: Solutions like Fluentd and Elasticsearch are commonly used.
- Centralized Logging: Logs from all nodes and pods are sent to a centralized log store.
- Log Analysis: Advanced querying for troubleshooting and insights.
Sample Cluster Log:

Conclusion
In-depth knowledge of Kubernetes logging at the pod, node, and cluster levels is essential for maintaining a robust and efficient Kubernetes environment. By leveraging modern log aggregation and analysis tools, administrators and developers can gain valuable insights into their applications and infrastructure, ensuring optimal performance and reliability.
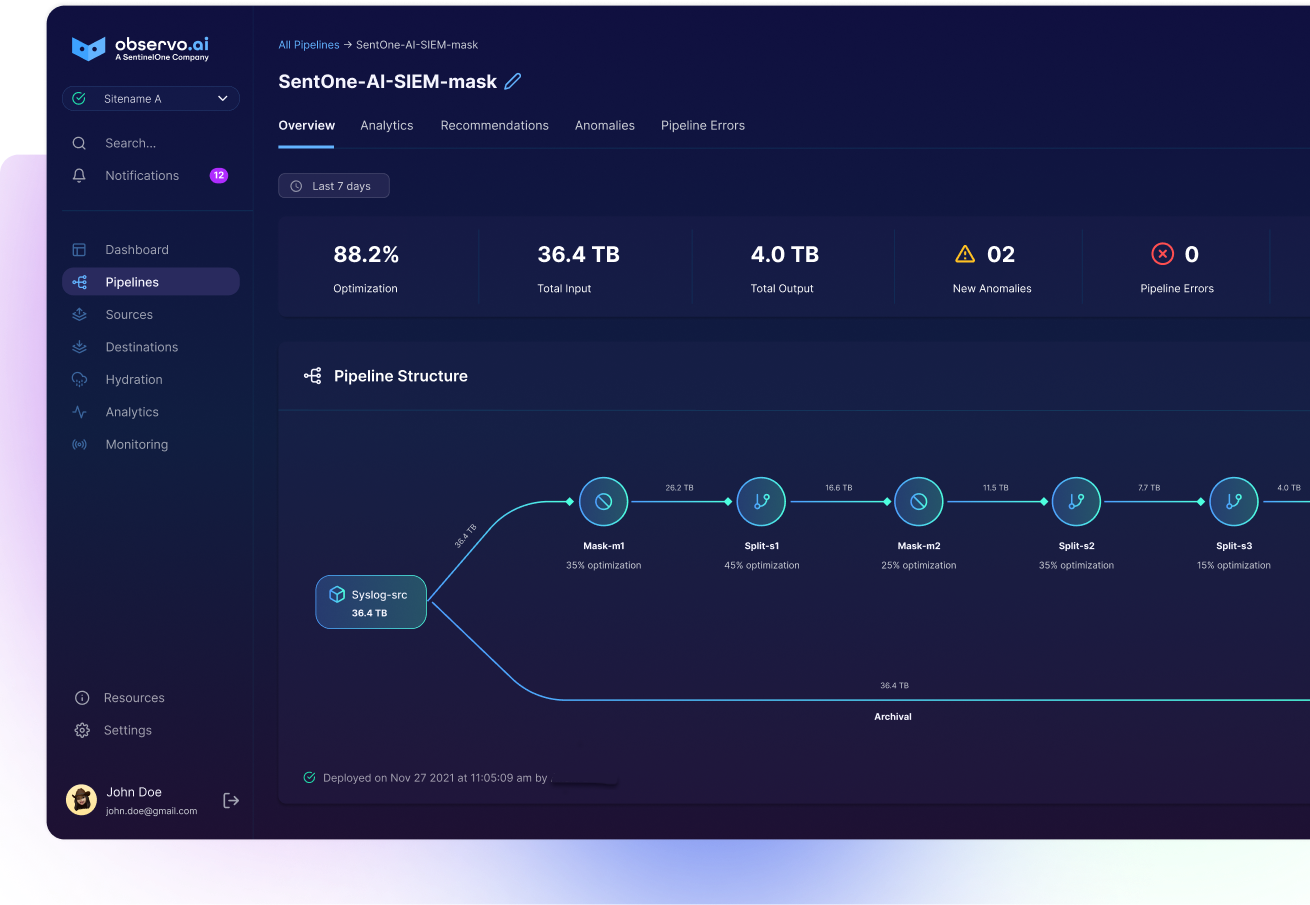
Observo.ai offers an AI-based Observability pipeline solution that seamlessly supports Kubernetes logs as a data source. It uses advanced analytics and machine learning to analyze log data in real-time, providing insights into system performance and security events. Observo.ai enhances the value of Kubernetes logs by offering automated anomaly detection, intelligent alerting, and integration with other observability tools.


